LESS CURTAILMENTS, MORE SAVINGS
pTrack® - Peak Tracker & Real-Time Energy Grid Analytics
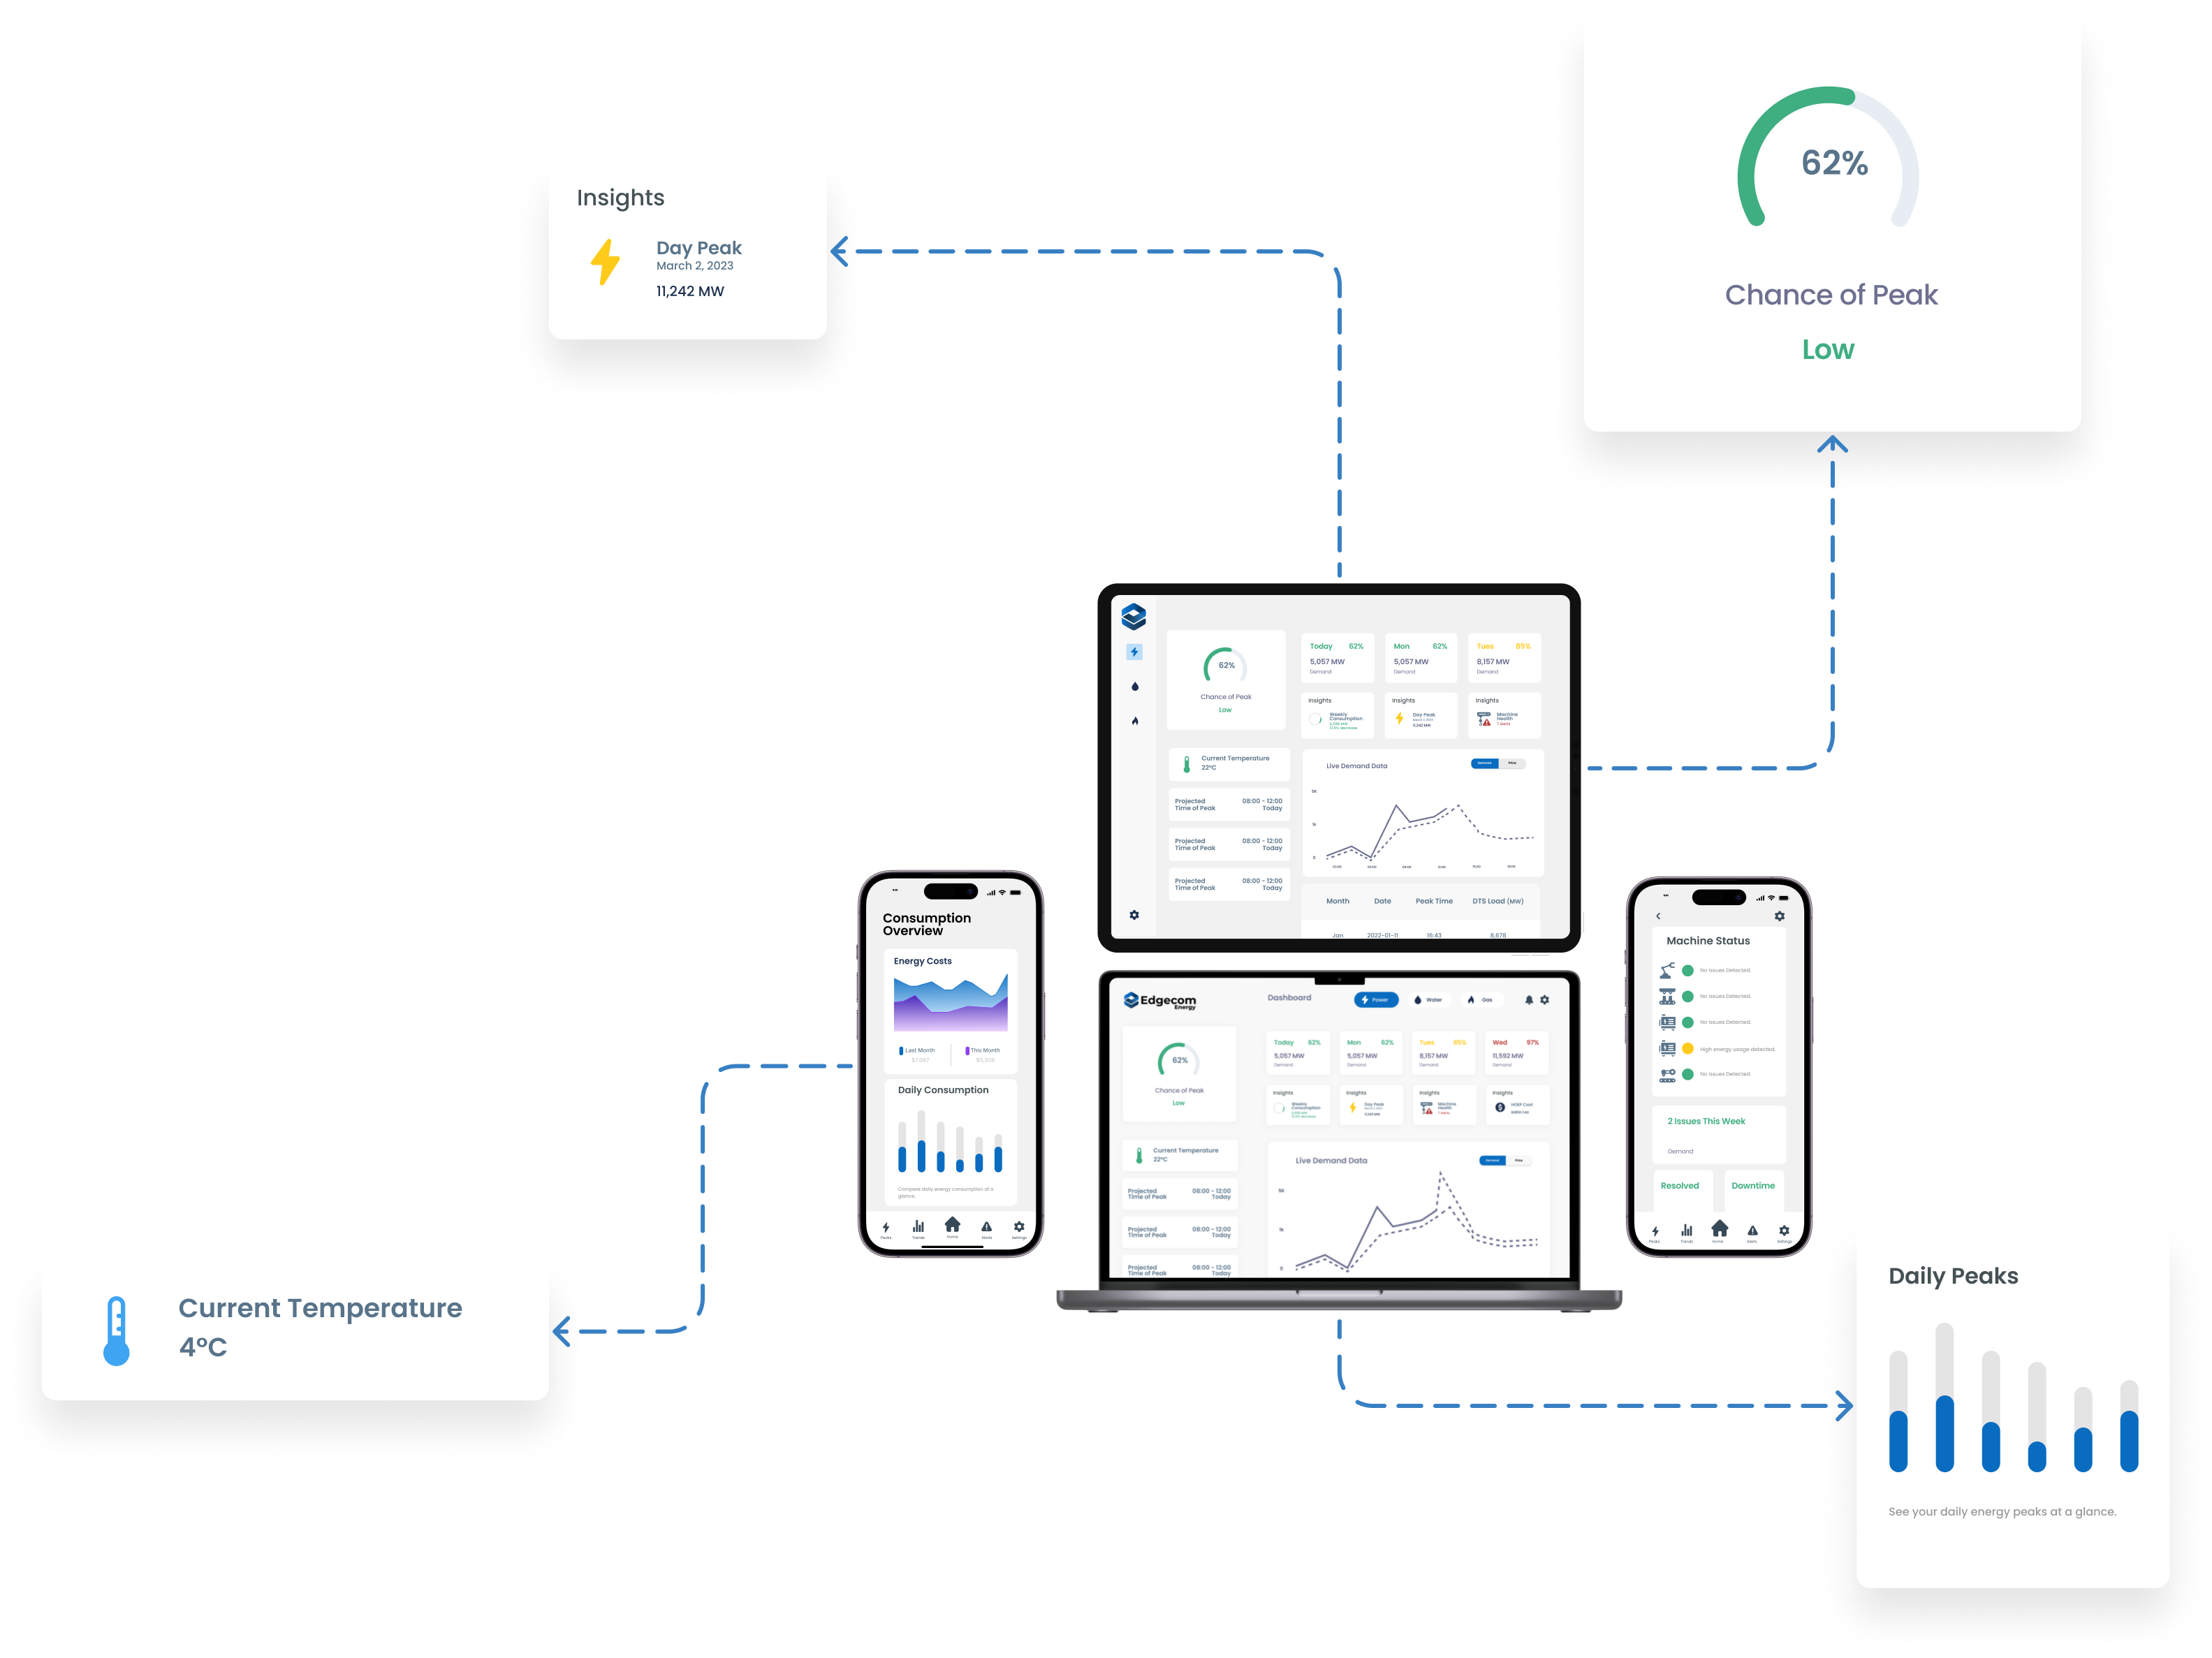
The most accurate peak tracking and coincident peak predictions, with real-time energy grid analytics, are powered by AI algorithms to ensure you will never miss a peak event.
Fewer curtailments, more savings
pTrack® - Peak Tracker & Real-Time Energy Grid Analytics
The most accurate peak tracking and coincident peak predictions, with real-time energy grid analytics, are powered by AI algorithms to ensure you will never miss a peak event.
Peace of Mind Not
Peak Hours On Your Mind
Why pTrack® for Peak Tracking?
Maximize Revenue
Advanced Notice
Eliminate Manual Work
Get Our pTrack® Performance History

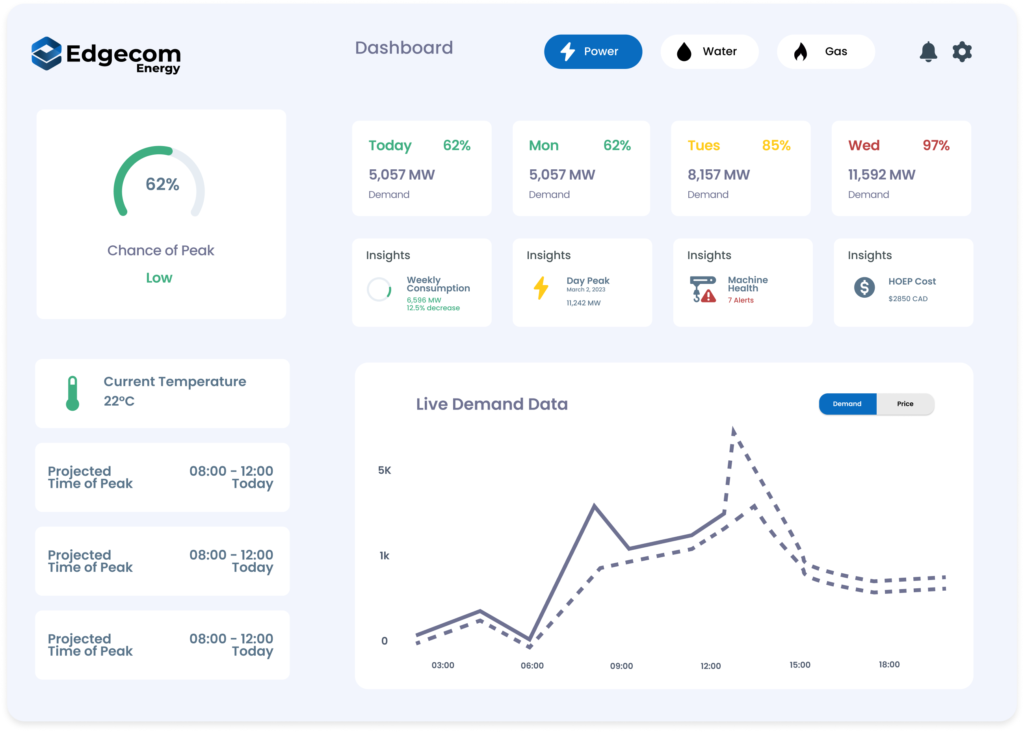
real-Time visibility
No Guessing Games
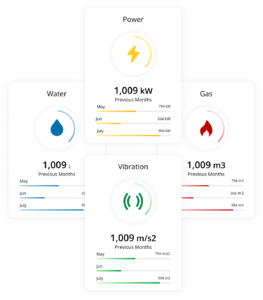
IoT Hardware
Accessible Anywhere
Customizable Notifications
Peak Forecasts
Access 14-day peak forecasts to strategically plan your curtailment and mitigate its impact on your production process.
Live Grid Demand Data
Weekly Reports
Receive a weekly summary and predictive peak events report
availability
Available in these Markets
Alberta
pTrack® Alberta
Ontario
pTrack® Ontario
Testimonials
Loved by Our Customers
Taylor Stanley
The partnership we found with Edgecom and the solution we found with pTrack® was exactly what we were looking for.

Jake Neufeld
Edgecom has been accurate right from the start. It gave us great comfort being able to see on the dashboard these projected peaks coming in.

Brandon Hastie
The amount of savings that we've had this year, we're on track to over $100,000 to $120,000 in energy savings this year.


Solutions
More Energy Management Solutions
dataTrack™
Faster data, faster decisions, faster revenue. Highly scalable asset and energy management platform enabling monitoring and targeting for large energy consumers.

NeuraCharge
NeuraCharge optimizes Distributed Energy Resources, enhancing BESS management to lower costs, boost revenues, and mitigate risks using AI technology

Demand Response
Ontario consumers can generate income by reducing demand and aiding the grid during peak stress periods, requiring occasional load curtailment.
Contact Us Today!
Interested in our energy solutions? Contact us today for more information and talk to one of our energy specialists.