pTrack™ is Edgecom Energy’s ICI (Industrial Conservation Initiative) peak prediction service for Class A consumers in Ontario. The Global Adjustment (GA) costs for Class A consumers are calculated using their share of energy usage that contributes to the top 5 system coincident peaks, which is when overall demand for energy is the highest. Using machine learning and artificial intelligence, pTrack™ accurately predicts the top 5 coincident peaks, primarily occurring during warm summer days, reducing the number of curtailments required to minimize energy costs. Our sophisticated software has never missed a peak, and curtailments are easy to plan thanks to the simple text message, phone call, and email alerts that details the exact hours in which consumption needs to be reduced. Additionally, customers can view the impacts of their curtailment during peak day events in real-time on our web-based platform and mobile application, ensuring your company is able to realize maximum savings.
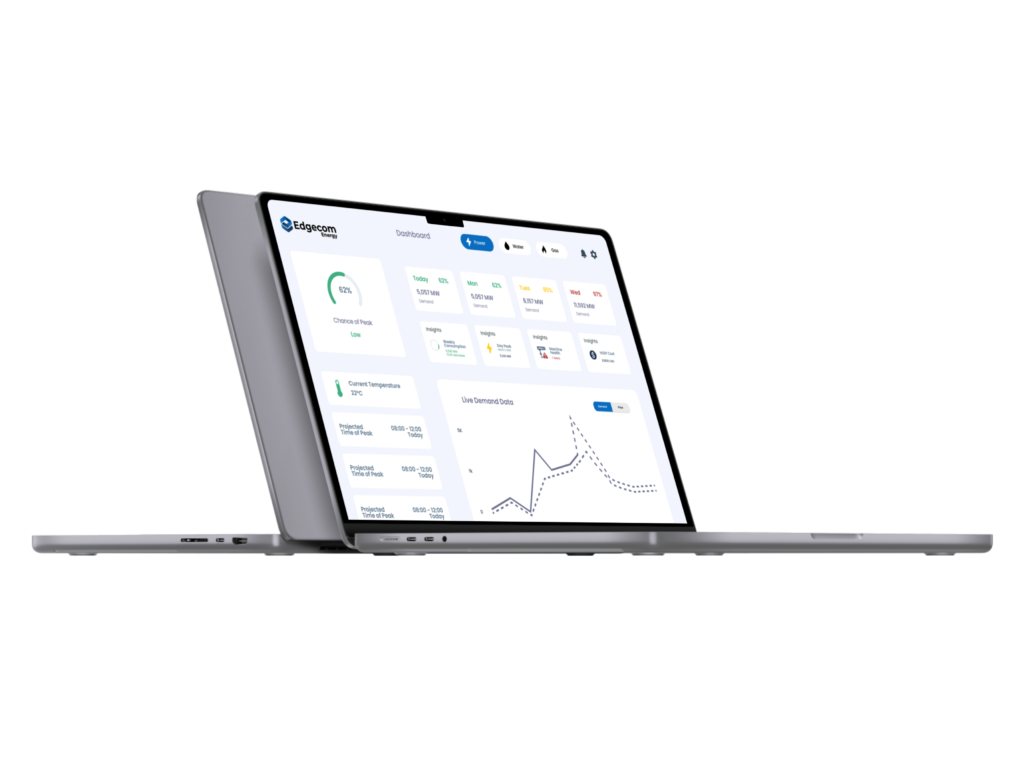
Our pTrack™ portal provides your team with all the data required to know specifically when to curtail your facility’s energy consumption, including:
- Probability of today being a peak day
- Today’s peak demand
- Current hourly and 5-minute Ontario demand displayed in real-time
- Probability of upcoming peak days
- Easy to read chart showing pTrack™ demand forecast, updated every 5 mins
- Real-time dollar savings and carbon emissions
.png)
Edgecom Energy is constantly striving to improve the products and services we provide our customers. We’re constantly adding new features to our portal with the goal of becoming the leading energy management software capable of supporting all your facility’s peak and energy management needs. The following features have recently been added to the portal:
Device Monitoring
While the portal previously focused mainly on facility level peak management data, we have recently expanded the focus and introduced additional service modules that allow for real-time energy consumption and sub-metering data to be seen alongside peak management data. This means that you can now have every machine and process individually metered and monitored, instead of just your main utility meter. This allows you to zoom in on different departments and machines, and compare this new granular data with your overall peak management information to see the impact and efficiency of each device.
Customizable Alarms
Additionally, our team has programmed customizable device alarms to alert users if there is an abnormal increase or decrease in consumption. Since electricity cannot be “seen”, the only way to detect electricity wastage is by metering it. Having visibility of abrupt variations in energy consumption is key in determining when and where something is going wrong, and allows your team to respond to and resolve issues quickly before they get out of hand.
Real-Time Data via IoT
Another new feature we’ve added is the ability to view consumption data from all your devices in real-time via our new IoT (Internet of Things) metering solution, which is a wireless, battery powered system capable of connecting to any device you want to meter. IoT ensures reliable, real-time data transfer for any physical devices you would like to monitor and control, leading to a better understanding of how your facility operates. This will help your team stay on track and monitor devices efficiently.
Customized Curtailment Windows
Previously, all customers received the same kind of curtailment notification on the portal. Based on customer feedback, these notifications are being customized to fit the individual needs and capabilities of each facility, so customers will receive varied lengths of curtailment events depending on their set thresholds. Customers who are only able to curtail for longer periods of time will receive lengthier curtailment windows, while those with more flexibility will receive shorter ones.
Our vision for the pTrack™ portal is to become a centralized platform for all your energy management needs. Our open API allows us to securely collect all required facility data, hosting everything in one place so our customers don’t have to switch between multiple platforms to access different energy management services. Although we haven’t quite yet realized our vision yet, these new features bring us one step closer to our goal.